Introduction
St James’ Independent Schools, founded in 1975, comprises a group of three Schools for boys and girls aged 4 -18 based in London and Surrey. Together, these independent schools offer a distinctive approach to education which provides for the intellectual, emotional, and spiritual development of every child.
In this case study we will explore the benefits of implementing the Schools BI online analytics tool into the Schools.
“Even getting access to simple stats was labour-intensive and tricky.”
Background
Prior to the introduction of Schools BI, the Schools held such a huge amount of data in their MIS but had no way of sharing this information with key stakeholders … well not in a way that didn’t make them run for the hills due to its complexity!
Plus, it meant extracting multiple data sets, which were then instantly out of date, and manually compiling them, before data analysis could even begin.
The Challenge
As it stood there was simply too much data available for anyone to use effectively to drive decision-making. Even getting access to simple stats, such as current attendance, was labour-intensive and tricky.
St James needed to first extract data from SchoolBase, then present it in a visually appealing fashion, all whilst the data was current. Secondly the information needed to be viewed under multiple parameters, i.e. by Group, by School and by Year.
The Solution
Schools BI and St James worked closely together to conceptualise the dashboards. Schools BI then went away to do the whizzy clever technical stuff in the background to interface with SchoolBase to extract the relevant data, and perform the data modelling so that every aspect displayed correctly.
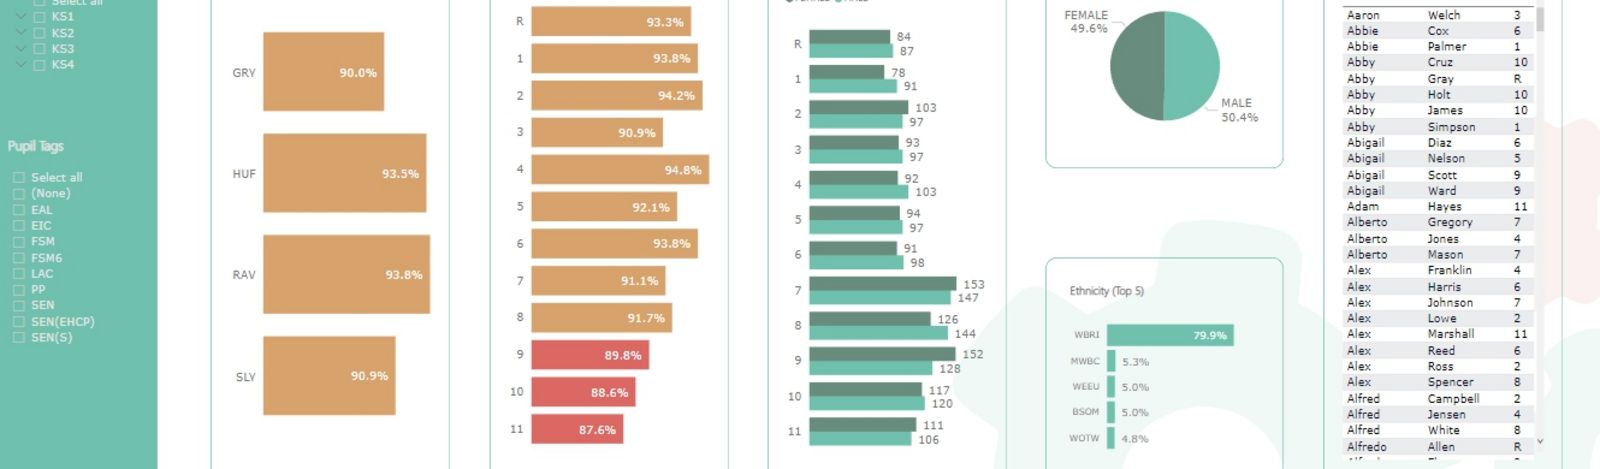
Now St James’ Independent Schools has a set of dashboards that signposts them to key data:-
Monthly attendance data
- Versus other regional schools and specific local authorities
- By region & local authority
- With multiple additional filters such as SEN & EAL, to name a few.
Attendance tracking
- Compared against the previous 5 years’ attendance
- Authorised vs unauthorised absence
- Identify monthly peaks in absences by absence type, e.g. were there more absences around Christmas, and are there more illnesses in winter?
Behaviour & Sanctions
- To show the ratio of rewards vs sanctions according to year group.
- Type of reward or sanction.
“From the beginning, no request we had was too small.”
A word from St James’ Independent Schools
“We found that with our MIS system we were sat on such a rich set of data, however we had no way of getting that data out to key stakeholders. Kate and Carl helped show us the best way to make the data visible in clear manner and as a result this system has helped shape our decision making.
From the beginning, no request we had was too small and Carl was excellent in making time to meet and go through the ideas we had in more detail.
Everyone is excited to use Schools BI and I look forward to continuing to work with them in the future.”